Entropy of Jazz
Submitted by Cody Kommers on May 7, 2015 - 6:40am
Each month, Ethnomusicology Review partners with our friends at Echo: A Music-Centered Journal to bring you “Crossing Borders,” a series dedicated to featuring trans-disciplinary work involving music. ER Associate Editor Leen Rhee welcomes submissions and feedback from scholars working on music from all disciplines.
This month, our contributor is Cody Kommers. Cody is currently a fourth year cognitive science student at UCLA and will be joining Apropose, a Silicon Valley startup, as a human-centered data scientist after graduation. His work pursues data driven solutions for humanistic problems, especially those in music, language, and design. For more about his research exploring computational models of jazz improvisation, see his website.
* * *
In 1937, Claude Shannon submitted his thesis at 21 years old to complete the electrical engineering master’s degree at MIT.i In this paper, now known as the “most famous masters thesis of the 20th century”ii he provided a theoretical foundation for the then-coming computer revolution. This paper, essentially proposing the idea of using 1s and 0s in computers, is not even his most influential. Shannon is best known for single-handedly creating the field of information theory in relative entirety, seemingly without any precedent.iii Even in a century inaugurated by the discovery of the photoelectric effect and punctuated with the creation of the personal computer, it is difficult to overstate Shannon’s contributions to technological development.
Shannon was born on April 30, 1916 in Petoskey, Michigan to a small, Midwestern family. His father, Claude Sr., was a self-made businessman, and his mother, Mabel, was a teacher. He lived in Michigan until he moved to Boston to attend graduate school. Not much is known about Shannon’s early life. As a young man, Shannon possessed the slender, tidy appearance of one who works with numbers and buoyant detachment of one who was meant to do so. He was gentle without being tepid, never judged a problem by its perceived utility, and had a self-proclaimed affinity for funny motions. During his career at Bell Labs (the famous laboratory founded by Alexander Graham Bell), he provoked both curiosity and reverence from his coworkers. He spent his nights juggling on his unicycle, riding through the halls after everyone else had gone home. The singular feature of his desk was the “Ultimate Machine”. This box had only one switch—when flipped, the lid opened, a robotic arm reached out, flipped off the switch, and closed the box.
Shannon named the central concept of his information theory “entropy” (distinct from entropy in the second law of thermodynamics). Simply stated, Shannon’s entropy measures uncertainty in information. To illustrate, one who plays the game “20 Questions” by first asking “is it my left pinky toe?” rather than “is it fictional?” is not taking into account entropy. If the first question is answered in the negative, one has not gained much information—it could still be anything, including your right pinky toe. In contrast, regardless of whether the second question is answered in the negative or the affirmative, one crosses off about half of the possible answers. The difference in the information one acquires is quantified by Shannon’s entropy.
Shannon initially demonstrated the power of entropy on understanding how letters fit together in English words.iv Imagine seeing a word beginning with the letters ‘re-‘. Which letter will come next? There are any number of likely possibilities—return, relate, reveal—all with different letters in their third position. In contrast, if one sees a word that begins with ‘q‘, it is very likely that the next letter will be ‘u’. We know this from experience—‘u’ almost always comes after ‘q’. In this case, if one knows the next letter is proceeded by a ‘q’, there is very little uncertainty about what it will be. The difference between these two cases can be quantified by Shannon’s entropy as well. The common denominator between guessing letters and 20 questions is that not all information is created equal; what you know influences how much you don’t know.
The assumption underlying Shannon’s entropy is that whatever happens next depends on whatever just happened (e.g., the ‘u’ depends on the ‘q’). This broad, rather trivial assumption allows entropy to be measured in other sequences, such as words in language and notes in music. With language, this is the basic mechanism behind one’s smartphone being able to predict the next word to be typed. Analogous to the case with letters, the word “are” is more likely to follow from “my children” than “is” would be. The smartphone knows this because “my children are” occurs far more frequently than “my children is”—the phone’s uncertainty concerning the next word can be measured with entropy.
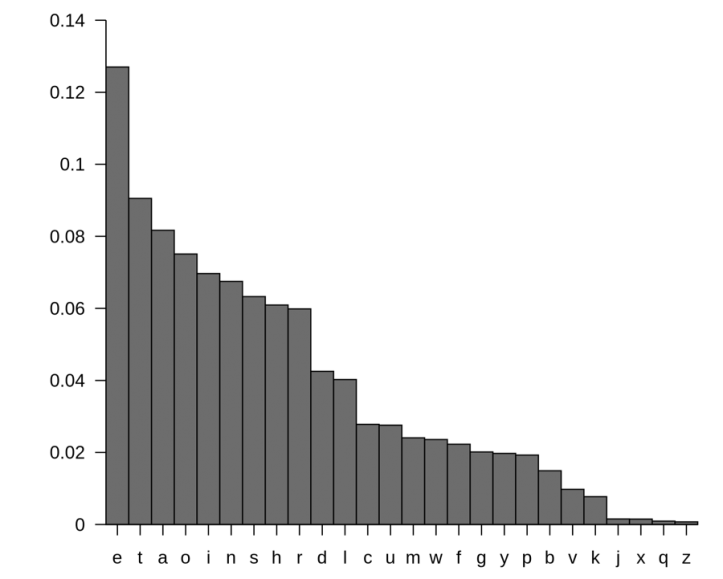
Graph 1. Distribution of letters in English language as a percentage of occurrence (e.g, occurring 1 of every 10 letters = 10% = 0.1).v
Similarly, with music, it is possible to guess the next pitch to be played from the preceding pitches. In a simple case, if one sees the first three notes of a major scale, then one is relatively likely to see the fourth note come next. This can also be measured by entropy. Consider the different levels of predictability in different kinds of music. In pop, pitches are likely to be from the same key and cluster around the same range. In jazz, the key and range will be constantly shifting. Different genres of music have different levels of entropy.
At first, it seems unsurprising that entropy could be measured in music—different styles of music have different idiomatic phrases, akin to language. But it is unclear exactly what the commonality between letters, language, and music is that would allow them to be quantified in such a manner. The reason that one, speaking standard American English, says “my children are” rather than “my children is” follows from a relatively severe grammatical restriction concerning verb conjugation. The equivalent restriction in music is not obvious. Sure, it would be a little uncouth to play an Eb over a C major, but one is certainly more likely to hear such a thing from Charlie Parker before one would hear “It were the best of times” from Charles Dickens.
This common structure underlying music, language, letters, and many other social and natural phenomena was discovered by George Kingsley Zipf, a professor of linguistics at Harvard, in 1935—more than a decade before Shannon proposed information theory. Zipf was born near the beginning of the 20th century to a family of second generation German-Americans. Though he made his living from studying words, Zipf did not believe in owning books; he relied on libraries for all but his dictionaries and philological resources. Zipf’s colleagues viewed him as “the kind of man who would take roses apart to count their petals.”vi
Zipf proposed that, in any given language, only a few words comprise the majority of usage while the vast majority of words are rarely ever used.vii This feature of usage of words can also be generalized to phenomena such as usage of letters, usage of pitch and rhythmic sequences, populations of cities, GDPs of nations, and traffic of internet sites. In each of these cases, only a couple entities get the majority of the action.
Zipf discovered his famous principal in what is perhaps the least enthralling linguistic endeavor of the 20th century: He decided to tally the number of times each word occurred in James Joyce’s Ulysses. Counting the appearance of each word, he found that some words, such as “indisputable”, occur only twice while others, such as “the”, occur once out of every eighteen words.
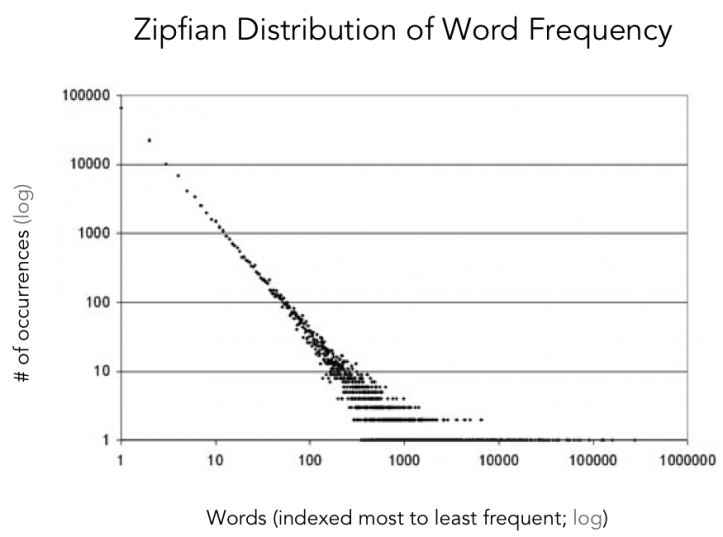
Graph 2. Distribution of usage in English language.viii Notice that only a couple words are used more than 1000 times (e.g., “the”); most words are used less than 10 times (e.g., “indisputable”). These data are from a large sample of English from a social media website.
As it turns out, frequencies of musical notes behave largely like word frequencies in this manner. Just as there are words that are much more frequently used than others, there are sequences of pitches that are much more frequently used than others. The same goes for rhythmic sequences. Out of all the possible sequences of pitches and possible sequences of rhythms, a relatively small handful make up the majority of what is played. This may at first comes as a surprise. Upon first listening to John Coltrane’s solo on Giant Steps, it may seem incredibly arbitrary or even unstructured. But, quantitatively, the music is full of structure.
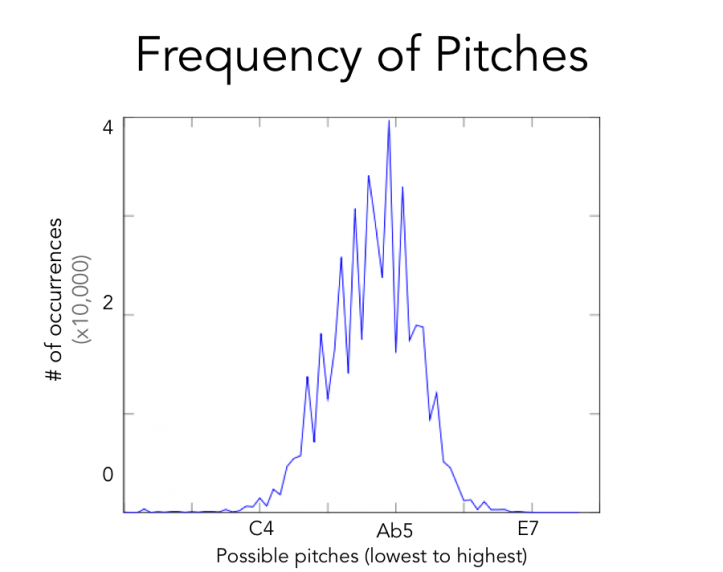
Graph 3. Distribution of pitches from a sample of 800 jazz saxophone solos.ix Pitches are roughly normally distributed around a mid-range.
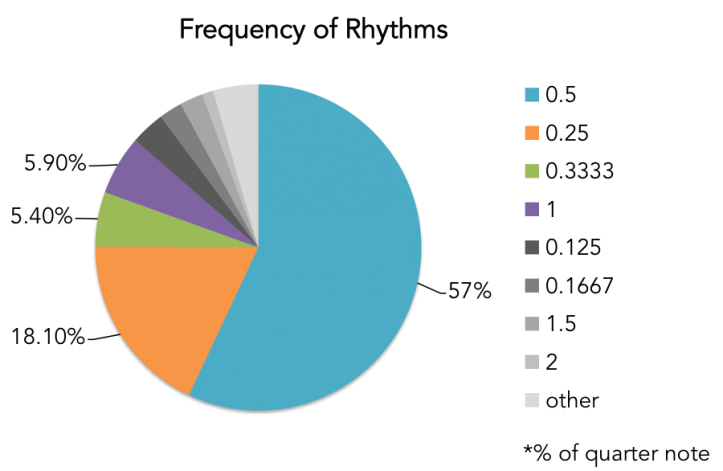
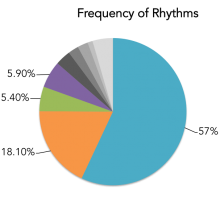
Graph 4. Frequency of single rhythms. Four rhythms (8th, 16th, triplet, quarter) make up over 80% of all rhythms played.
The research on which I am presently working seeks to use Shannon’s entropy to model jazz improvisation. My goal is to take a large sample of jazz saxophone recordings and create a probabilistic model that is able to learn from those examples. Think of a neophyte jazz musician: in order to learn her instrument, she will spend hundreds of hours attempting to play what Stan Getz played verbatim. It is the same idea behind my model. If a jazz saxophonist just played a C5, then that ought to tell us if the next note is more likely to be D5 or Eb3. As the model takes into account more previous notes, then it starts to identify these common sequences. For example, notes in the same major chord tend to follow each other in sequence; at least more so than notes that are not. A sound clip of the model’s improvisation is included below.
* * *
What does Shannon’s entropy and Zipf’s distribution of frequencies add to one’s appreciation of music? Attempting to break down any inherently creative human act into its constituent components for quantitative study runs the risk of losing the heart of artistic nature. While one certainly could make an argument that understanding of this sort does not augment the enjoyment of music, I would posit that it contributes to a new level of understanding. Shannon’s entropy and Zipf’s frequency distribution are not in opposition to appreciation of beauty and humanity; in contrast to what some have alluded, it is not actually the case that one must pick the petals of a flower in order to count them.
Footnotes
i Shannon, Claude Elwood. "A symbolic analysis of relay and switching circuits." American Institute of Electrical Engineers, Transactions of the 57, no. 12 (1938): 713-723.
ii Gardner, Howard. The mind's new science: A history of the cognitive revolution. Basic books, 2008.
iii Shannon, Claude Elwood. "A mathematical theory of communication." ACM SIGMOBILE Mobile Computing and Communications Review 5, no. 1 (2001): 3-55.
iv Shannon, Claude E. "Prediction and entropy of printed English." Bell system technical journal 30, no. 1 (1951): 50-64.
v http://en.wikipedia.org/wiki/Letter_frequency
vi Zipf, George Kingsley. "The psycho-biology of language." (1935).
vii Ibid.
viii http://firstmonday.org/article/view/2117/1939
ix Kommers, Cody. “Computational Models of Jazz Improvisation.” www.cydeko.com
"Sounding Board" is intended as a space for scholars to publish thoughts and observations about their current work. These postings are not peer reviewed and do not reflect the opinion of Ethnomusicology Review. We support the expression of controversial opinions, and welcome civil discussion about them. We do not, however, tolerate overt discrimination based on race, sex, gender, sexual orientation, or religion, and reserve the right to remove posts that we feel might offend our readers.
What's New

On 22 May 2023, the UCLA academic community and Filipinx American performing artists celebrated the launch of the Danongan Kalanduyan Collection on California Revealed.Danongan “Danny” Kalanduyan (1 May 1947 – 28 September 2016) taught...

Dilla Time: The Life and Afterlife of J Dilla, the Hip-Hop Producer who Reinvented Rhythm. By Dan Charnas. New York: Farrar, Strauss and Giroux. 2022. Reviewed by Aisha Gallion “So Far To Go” is likely the first song I ever heard by...